Exploring Observability and Log Analytics Platforms
My experience with monitoring network elements gives me a practical lens for understanding observability platforms. Collecting logs is only the beginning. The platform has to turn large, uneven streams of telemetry into evidence that helps someone notice a problem, understand its scope, and decide what to do next.
Start with the questions the platform must answer
Before choosing collectors, storage, or dashboards, I want to know who investigates the system and what they need to learn.
- Is a service or network element healthy right now?
- When did behavior change, and what changed near that time?
- Is the problem local, regional, limited to one tenant, or widespread?
- Which dependency, interface, device, or software version is involved?
- Are users affected, or is only an internal signal unusual?
- Can the evidence be retained long enough for investigation and audit?
Telemetry should help answer a question. Collecting everything without a purpose can create high cost and low signal.
A platform is a data pipeline
Network elements, applications, cloud resources, and user devices emit data in different formats and at different rates. A common flow looks like this:
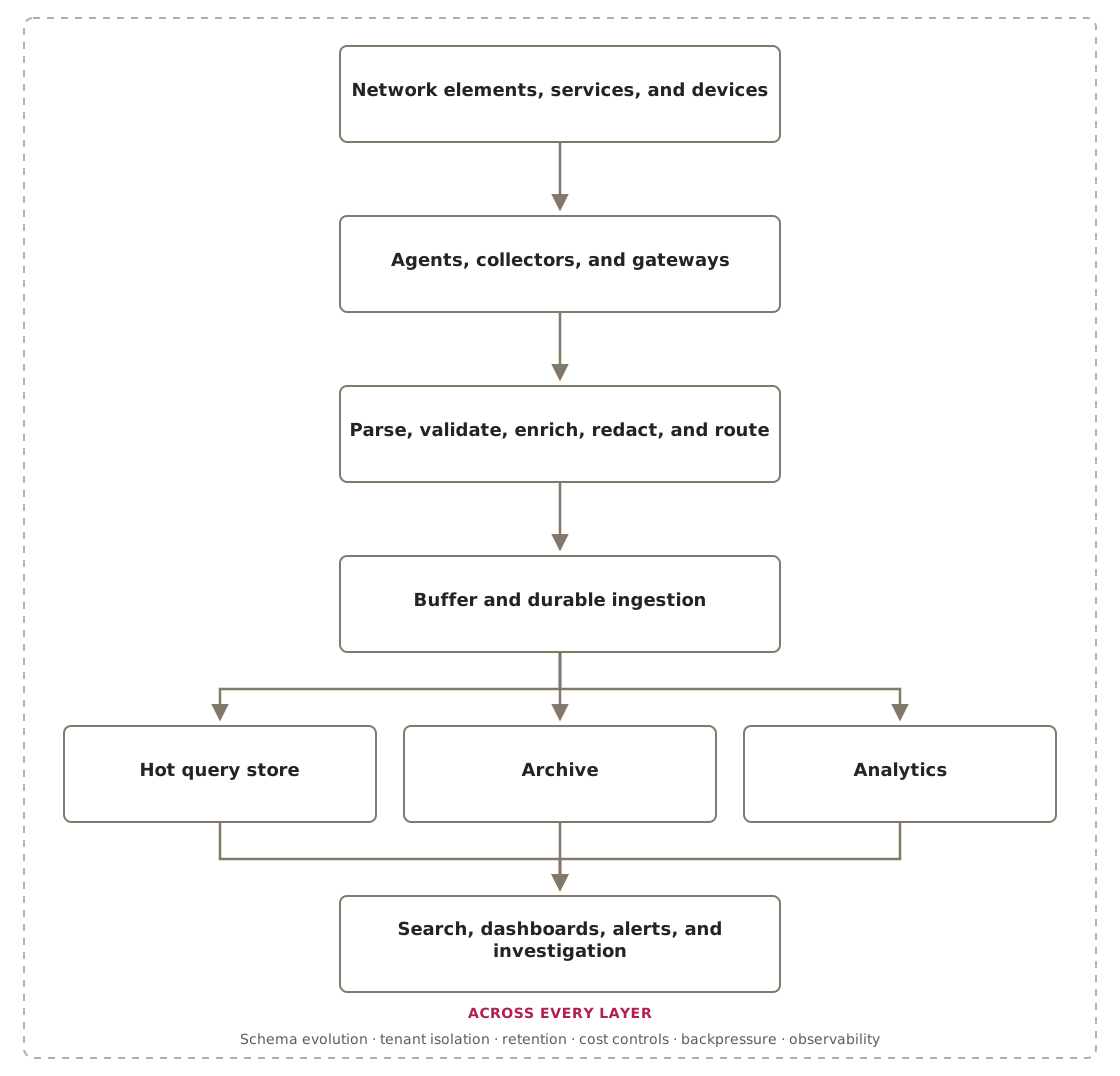
Each stage needs its own failure behavior. A collector may lose connectivity, a parser may reject a new schema, a queue may fall behind, or a query store may become too expensive under high cardinality.
One possible implementation
Sources could emit standard telemetry through the OpenTelemetry Collector, with Apache Kafka providing durable buffering and replay between ingestion stages. ClickHouse can support high-volume event and log queries, Prometheus can hold operational metrics, and object storage can provide lower-cost archives.
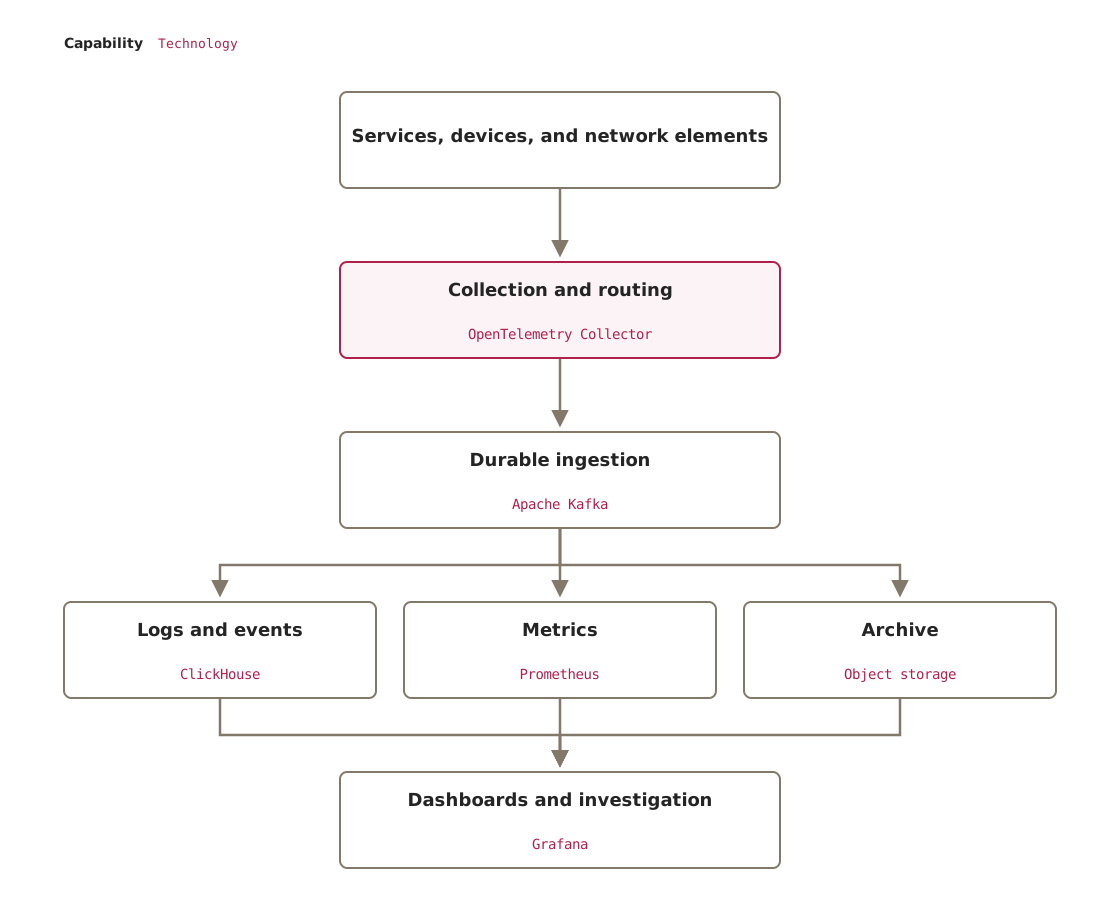
Grafana can unify dashboards and investigation links across stores without pretending every signal has the same data model. Retention, cardinality, query latency, tenant isolation, and operator expertise should decide whether these components are separate systems or a smaller managed platform.
Logs, metrics, traces, and events answer different questions
Logs provide detailed records of discrete events. Metrics summarize behavior over time. Traces connect work across boundaries. Topology and inventory describe what exists and how components relate.
For network monitoring, counters, alarms, configuration changes, interface state, software versions, and topology can be more useful together than any one signal alone.
Symptom in metric
       ↓
Affected element and topology
       ↓
Related alarms, logs, and changes
       ↓
Probable scope and next investigation step
Correlation should preserve the original evidence. A derived incident is useful only when an operator can inspect why the platform created it.
Identity and time make correlation possible
Telemetry needs stable identifiers for tenant, site, device, interface, service, region, deployment, and software version. Display names can change and should not be the only key.
Time is also imperfect. Devices drift, events arrive late, batches are replayed, and timestamps may describe generation, collection, ingestion, or processing. The data model should preserve these differences rather than overwrite them with one convenient time.
Schema evolution is continuous
Firmware, applications, vendors, and teams change the shape and meaning of telemetry. Parsers should be versioned, observable, and tolerant of additive changes. Invalid records need quarantine and sampling for diagnosis rather than silent deletion.
An event schema should define units, severity, identifiers, optional fields, sensitive fields, and compatibility expectations. Enrichment adds context such as topology or ownership, but the platform should distinguish source fields from derived fields.
Ingestion must survive bursts and disconnection
Failures often produce more telemetry than normal operation. That is exactly when the platform is under the most pressure.
Collectors need local buffering where practical. Durable queues absorb temporary bursts. Backpressure, quotas, sampling, and load shedding prevent one source from exhausting the shared system.
Loss policy should be explicit. Dropping duplicate debug events may be acceptable. Losing security, configuration, or financial audit events may not be.
Storage follows access patterns and retention
Recent telemetry is queried frequently and needs low latency. Older data may be compressed into cheaper storage and restored only for investigations.
Useful decisions include:
- Which fields are indexed?
- Which dimensions have unbounded cardinality?
- How long is raw data retained?
- Which summaries should outlive raw records?
- How are tenant, region, and time used for partitioning?
- How are deletion, legal hold, and export handled?
Indexes make investigation faster but increase ingestion and storage cost. Retention should follow operational and legal value, not an assumption that more history is always better.
Query experience determines whether data is usable
Operators need fast paths for common questions and enough flexibility for unfamiliar failures. Search, a query language, saved investigations, dashboards, and notebooks can serve different levels of expertise.
The platform should make time range, sampling, units, missing data, and query cost visible. Results need stable links so an investigation can be shared and revisited.
Queries also need protection. A broad scan or accidental aggregation with high cardinality should not make the platform unavailable for everyone else.
Alerting should create action, not noise
An alert needs a meaningful condition, severity, owner, deduplication key, route, and runbook. Static thresholds are useful for known boundaries. Baselines and anomaly detection can find unexpected behavior but need context and careful tuning.
For network elements, one root failure can create many downstream alarms. Grouping and suppression that use network topology can reduce noise, but they must not hide independent failures.
I want to measure alert quality through acknowledgement, actionability, false positives, missed incidents, repeated pages, and time to resolution. An alert that nobody trusts is a platform defect.
Tenant isolation and security apply to every stage
Logs can contain identifiers, addresses, tokens, payloads, customer information, and operational secrets. Redaction should happen as early as possible. Encryption, tenant isolation, access based on roles, controls for individual fields, and audit history need to cover ingestion, query, export, dashboards, and support tools.
Access to telemetry should follow purpose. The ability to operate a service does not automatically justify access to every user or tenant field inside its logs.
The platform must observe itself
An observability platform needs its own health signals:
- Collection success and source silence
- Ingestion rate, rejection, and duplication
- Queue depth and oldest event age
- Parsing and enrichment failures
- Indexing delay and query latency
- Alert evaluation delay and notification delivery
- Storage growth, cardinality, and cost
Source silence is different from health. A device that stopped reporting may be unavailable, disconnected, decommissioned, or simply quiet. Inventory and expected reporting behavior provide the missing context.
What changes with AI agents
Agents could translate a question written in ordinary language into a query, summarize an incident, correlate changes, propose likely causes, or guide an operator through a runbook/troubleshooting guide. This can shorten investigation, especially when the platform contains many data types and tools.
The agent should link every conclusion to queries and source evidence. It should distinguish observation from hypothesis and state when data is incomplete or stale.
Telemetry itself is untrusted input. Logs, tickets, and device names can contain text that attempts prompt injection. An investigation agent needs isolated instructions, access that only permits reading by default, bounded queries, authorization that preserves tenant boundaries, redaction, and limits on cost.
Remediation raises the bar. Restarting a service, changing configuration, suppressing an alert, or isolating a device should pass through deterministic policy and often human approval. The agent may propose a plan, but the platform remains responsible for whether that plan is allowed.
Try the telemetry pipeline experiment
The burst-safe telemetry lab is a working prototype for buffering a traffic burst, enforcing a tenant quota, measuring dropped events, and draining accepted data to storage. It links to free OpenTelemetry and Prometheus resources.
Questions I am wondering about
- Which operational questions must the platform answer quickly?
- What happens to telemetry during source, network, parser, queue, or storage failure?
- How are identity, topology, event time, and ingestion time preserved?
- Which data can be sampled or dropped, and which must never be lost silently?
- How are schema changes detected and diagnosed?
- Can one tenant, source, or query affect everyone else?
- Are alerts actionable, owned, deduplicated, and measured for quality?
- Can investigators trace a derived insight back to raw evidence?
- Does retention match operational value, privacy, and cost?
- If an agent proposes remediation, who authorizes and audits the action?
What I want to remember
A log analytics platform is valuable when it reduces uncertainty during real operational work. That value comes from reliable ingestion, meaningful context, efficient investigation, trustworthy alerts, and visible evidence, not raw data volume.